Performance of Top 6 Indian Pharmaceutical Players : In-charts
Average ROCE vs Average Operating Margin
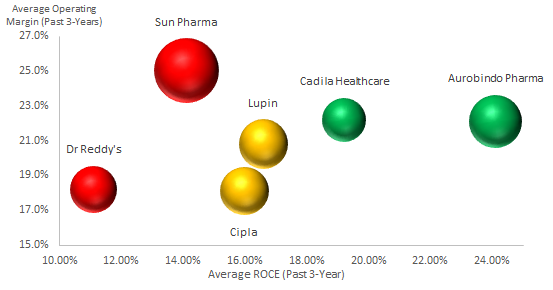
- Size of the bubble indicates revenue
- Colour of the Bubble indicates revenue growth during fiscal 2016 to fiscal 2019
- Red: Negative growth; Yellow: 0-5%; Green: Above 5%
Source: Company Reports
Gearing and Average ROE for Players
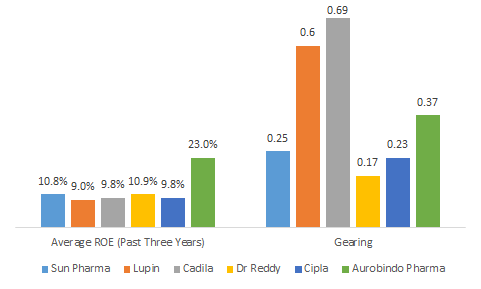
- The acquisitions by Lupin during 2016 and 2017 led to high leverage for the company; the subsequent write-offs due to inability to create anticipated synergies led to write-offs thereby leading to lower ROE
Source: Company Reports
P/E and Market Cap/Sales for top players
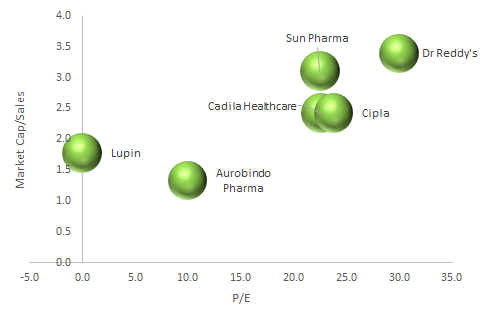
- Sales considered for fiscal 2019
- P/E for Lupin is not applicable as the company reported loss during 9M fiscal 2020 due to one time write-offs
- Dr Reddy’s currently enjoys the most premium valuations in the industry basis both metrics
Source: Company Reports
Revenue Share (as a % of sales) from Domestic and US* Market
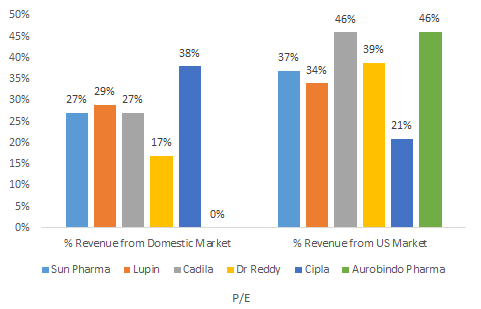
*Some Players report revenue for entire North American region
- Cipla generates the highest share of revenue from domestic market
- However, Sun Pharma is the leader in the domestic market
- Aurobindo Pharma has negligible presence in domestic market
- Higher share of revenue from domestic market ensures less volatility in top-line as well as overall profitability
- On the other hand, the US market presents avenues for para IV filings (drug launch immediately post para IV filing where players enjoy exclusivity for 180 days) where players enjoy very high margins; the margins for generics in US market have been under pressure for players across the board
Trend in R&D Spend
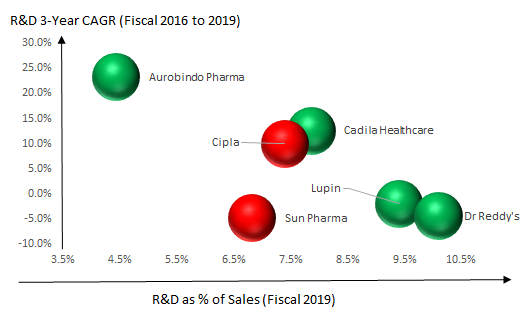
- Colour of the bubble indicates company’s presence/R&D projects in biosimilar space; Red bubble indicates ‘No Presence” whereas Green Bubble indicates ‘Presence’ in biosimilar segment
- Sun Pharma, Lupin and Dr Reddy’s rationalised their R&D spend during fiscal 2016 to fiscal 2019 after steep increase in the preceding two years and also on account of lower cash flows.
Source: Company Reports
